Introduction
The high-resolution grid dataset of industrial aquatic heavy metal emissions in China during 1998-2010 was constructed using a bottom-up approach. The emissions of five types of industrial aquatic heavy metals, including Hg, Cd, Cr(VI), Pb, and As, were calculated based on the monetary outputs of industrial enterprises and the corresponding emission coefficients. Subsequently, the heavy metal emissions of each enterprise were spatialized onto grid maps at the scale of 1 km×1 km to construct the grid emission dataset. The environmental impacts of industrial aquatic heavy metal emissions, including human health impacts and ecosystem quality impacts, were estimated based on ReCiPe2016.
The grid dataset can provide detailed information on the spatial distribution of industrial aquatic heavy metal emissions that can be used to refine aquatic heavy metal pollution control in China. It can also be used to analyze the environmental impacts and socioeconomic drivers of industrial aquatic heavy metal emissions.
Huang, Y.; Zhou, B.; Li, N.; Li, Y.; Han, R.; Qi, J.; Lu, X.; Li, S.; Feng, C.; Liang, S., 2019.Spatial-temporal analysis of selected industrial aquatic heavy metal pollution in China. Journal of Cleaner Production,238, 117944.
https://doi.org/10.1016/j.jclepro.2019.117944.
Example view of data
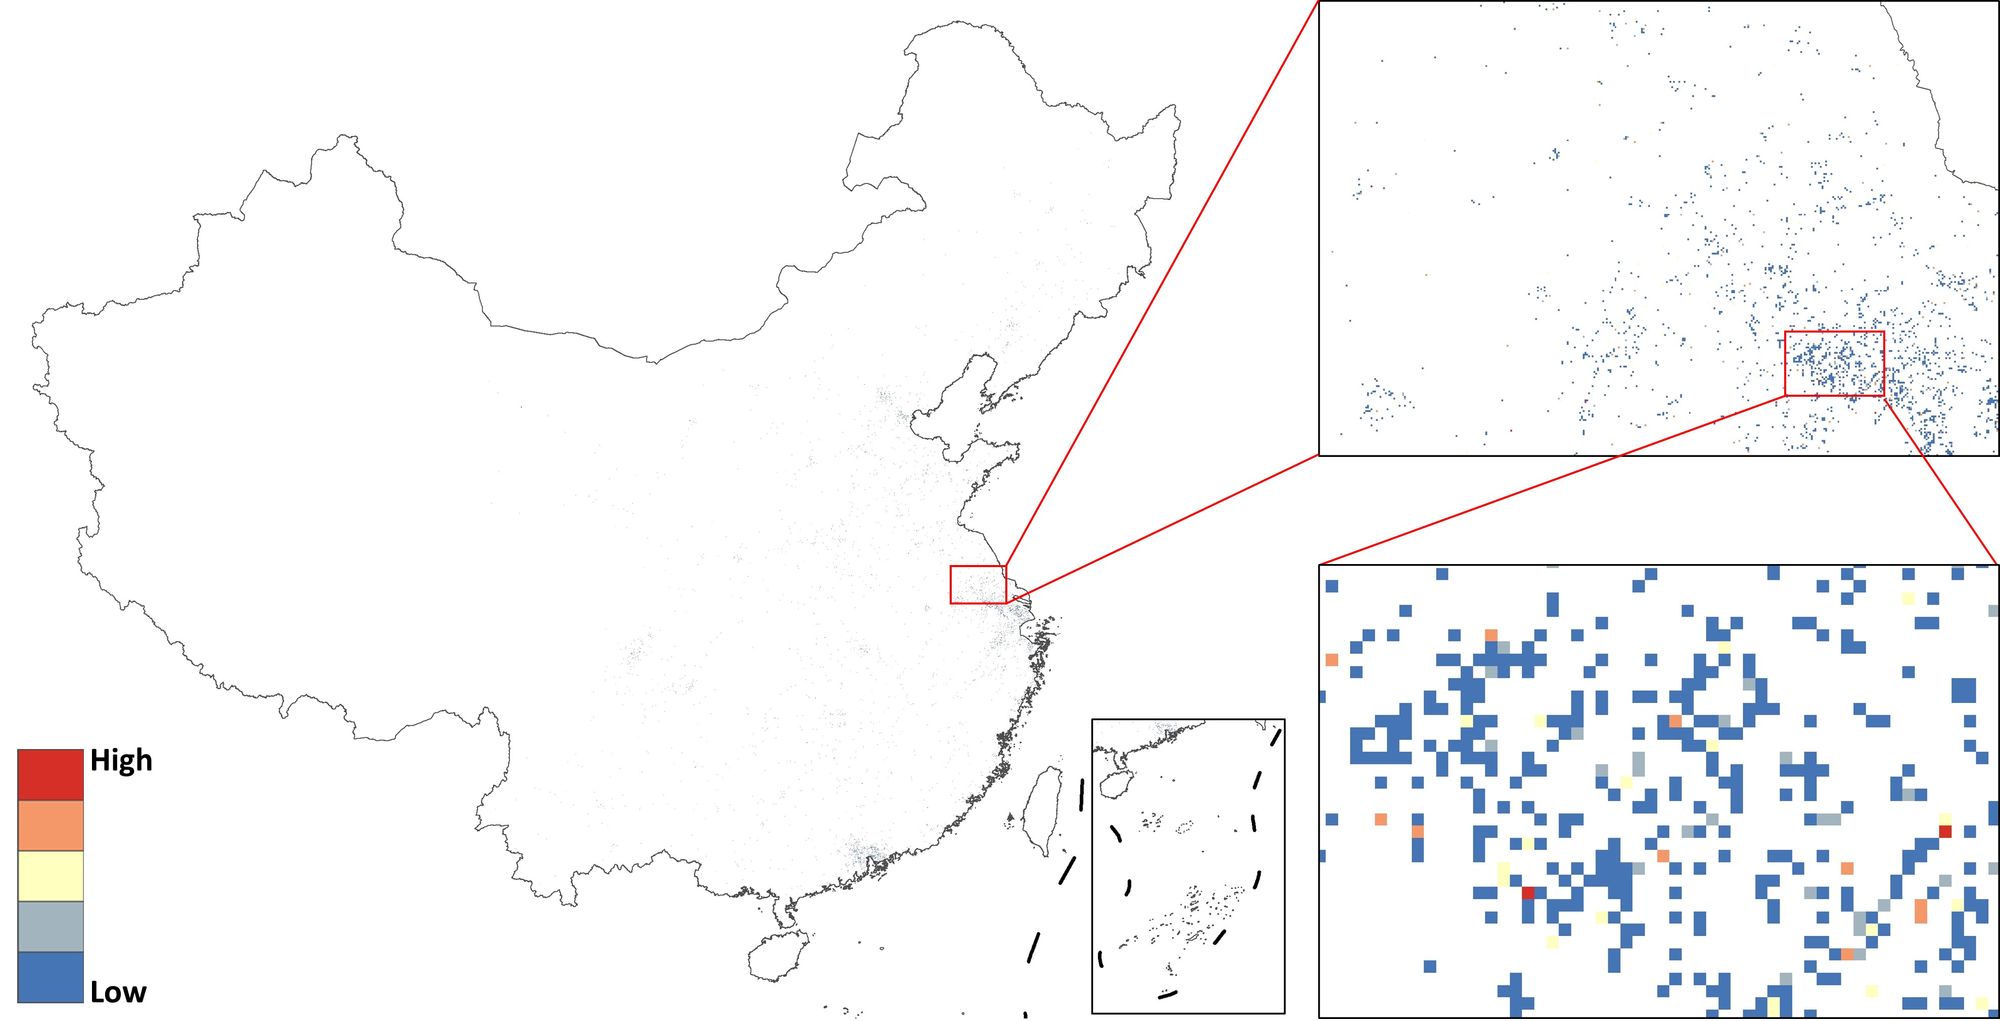
National and partial views of the grid dataset at 1 km×1 km scale (taking industrial aquatic Hg emissions in 2010 as example).
Industrial aquatic Hg emissions in China during 1998-2010
Kernel density map of industrial aquatic Hg emissions in China during 1998-2010
Industrial aquatic Cd emissions in China during 1998-2010
Kernel density map of industrial aquatic Cd emissions in China during 1998-2010
Industrial aquatic Cr(VI) emissions in China during 1998-2010
Kernel density map of industrial aquatic Cr(VI) emissions in China during 1998-2010
Industrial aquatic Pb emissions in China during 1998-2010
Kernel density map of industrial aquatic Pb emissions in China during 1998-2010

Industrial aquatic As emissions in China during 1998-2010
Kernel density map of industrial aquatic As emissions in China during 1998-2010
Spatiotemporal variations in human health impacts during 1998-2010

Spatiotemporal variations in ecosystem quality impacts during 1998-2010